What is “Data Sanity?”
Data Sanity means:
- Seeing statistics as the art and science of collecting and analyzing data simply and efficiently in the context of process-oriented thinking
- Using data as a basis for meaningful actions rather than collecting it for “museum purposes”
- Stopping wasteful meeting where data tables, variance reports, bar graphs, trend lines, and traffic light data displays are routinely used to make important organizational decisions
Armies of employees do nothing but collect, summarize, and report data. Armies of managers and technical professionals spend time reviewing these data and attempting to pull out something meaningful from the mass of charts they receive each week. Managers demand accountability for achieving goals and ask why numbers have gotten larger or smaller. Sound familiar?
How can data be a source of waste?
Some research and experience of Marc Graham Brown has shown four potential immediate benefits from taking an organizational commitment to “data sanity” seriously:
- A more than 50 percent reduction in the amount of time spent in monthly senior management meetings;
- The elimination of up to an hour each day spent by managers reviewing and attempting to interpret unimportant performance data;
- An 80 percent reduction in the volume of reports generated on a monthly basis by a corporate finance function; and
- A 60 percent reduction in the pounds of reports that were printed each day, reporting performance data.
Coming up with a good solid set of metrics and actually using it to manage will save thousands of hours of time wasted reviewing charts and graphs in meetings and reading reports on statistics that do not really matter.
If you figure two hours per week per technical or managerial employee times 48 weeks times the labor rate per hour, you’re talking a lot of money.
What are the basics of collecting data?
Three Data Themes
1. Collect meaningful data (a basis for ACTION)
2. Collect data over time
3. Use data to identify root causes of problems
The Eight Questions of Planning for Data Collection
1. Why collect the data? [Objective]
2. What methods will be used for the analysis? [Note: Before ONE piece is collected]
3. What data will be collected? [What process characteristic is important?]
4. How will the data be measured? [Do people agree on how to obtain the number?]
5. When will the data be collected? [How often will it be collected?]
[6 – 8 deal with the logistical process of actually collecting the data]
6. Where will the data be collected?
7. Who will collect the data?
8. What training is needed for the data collectors?
How does “statistical thinking” differ from the “Statistics from Hell 101” I was taught in the past?
There are three kinds of statistics. Using the contexts of manufacturing / health care / education:
Descriptive statistics: “What can I say about this individual widget / patient / student?”
Enumerative statistics: “What can I say about this specific group of widgets / patients / students?”
Analytic statistics: “What can I say about the process that produced both this group (sample) of widgets / patients / students and its results?”
Most basic required university courses teach statistics from an enumerative perspective – no concept of data either as a process or being produced by a process. A vital component in analytic statistics is assessing the process that produced any data, which is not generally taught.
Unstable processes (the rule in everyday work) actually invalidate the application of many traditional techniques. The good news is that an analytic perspective emphasizes simply “plotting the dots” (in their naturally occurring time order), causing improved, deeper conversations about data. This is demonstrated vividly in the next example.
Why is plotting the dots so powerful?
The following data table is handed out at a typical six-month “How’re we doin’?” meeting comparing three hospitals average length of stay. It summarizes the last 30 individual weeks of performance:
| Variable | Mean | Median | Tr
Mean |
StDev | SE
Mean |
Min | Max | Q1 | Q3 |
| LOS_1 | 3.027 | 2.90 | 3.046 | 0.978 | 0.178 | 1.0 | 4.8 | 2.300 | 3.825 |
| LOS_2 | 3.073 | 3.10 | 3.069 | 0.668 | 0.122 | 1.9 | 4.3 | 2.575 | 3.500 |
| LOS_3 | 3.127 | 3.25 | 3.169 | 0.817 | 0.149 | 1.1 | 4.5 | 2.575 | 3.750 |
What questions should you now ask?
What luck! You are “blessed”—A Six Sigma Black Belt is in your midst, loads the actual data onto the computer, and concludes:
“All three hospitals’ data pass the test for normally. Of course, we have to be cautious. Just because the data passes the test for normality doesn’t necessarily mean that the data are normally distributed…only that, under the null hypothesis, the data cannot be proven to be non-normal.”
Got that?
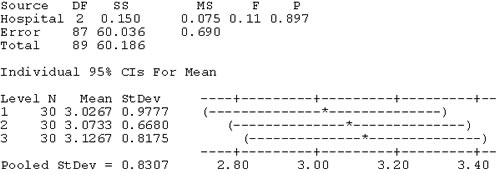
“Since the data can be assumed Normally distributed, one can proceed with the analysis of variance (ANOVA) to generate the 95% confidence intervals.”
One-Way Analysis of Variance

“The p-Value > 0.05: Therefore, there are no statistically significant differences as further confirmed by the overlapping 95% confidence intervals.”
What questions should you now ask?
WAIT A MINUTE!
- How was these data collected?
- Was all this analysis even appropriate?
- What about the process(es) that produced these data?
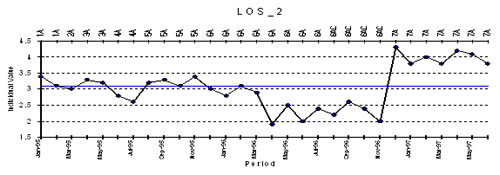
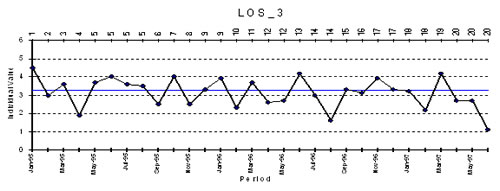
Since these data are in time order by week, what would a simple plot of the numbers in their naturally occurring time order look like?


NO DIFFERENCE?
What questions would you now ask now?
Which analysis would lead to the more meaningful conversation?
[Did you know that all of the previous “statistical analysis” was worthless?]


